On the SAT we will be using the Desmos Graphing Calculator (click here to try it out).
To access the Desmos keypad, you can press the up arrow by the keyboard icon in the lower left corner of Desmos (see below).
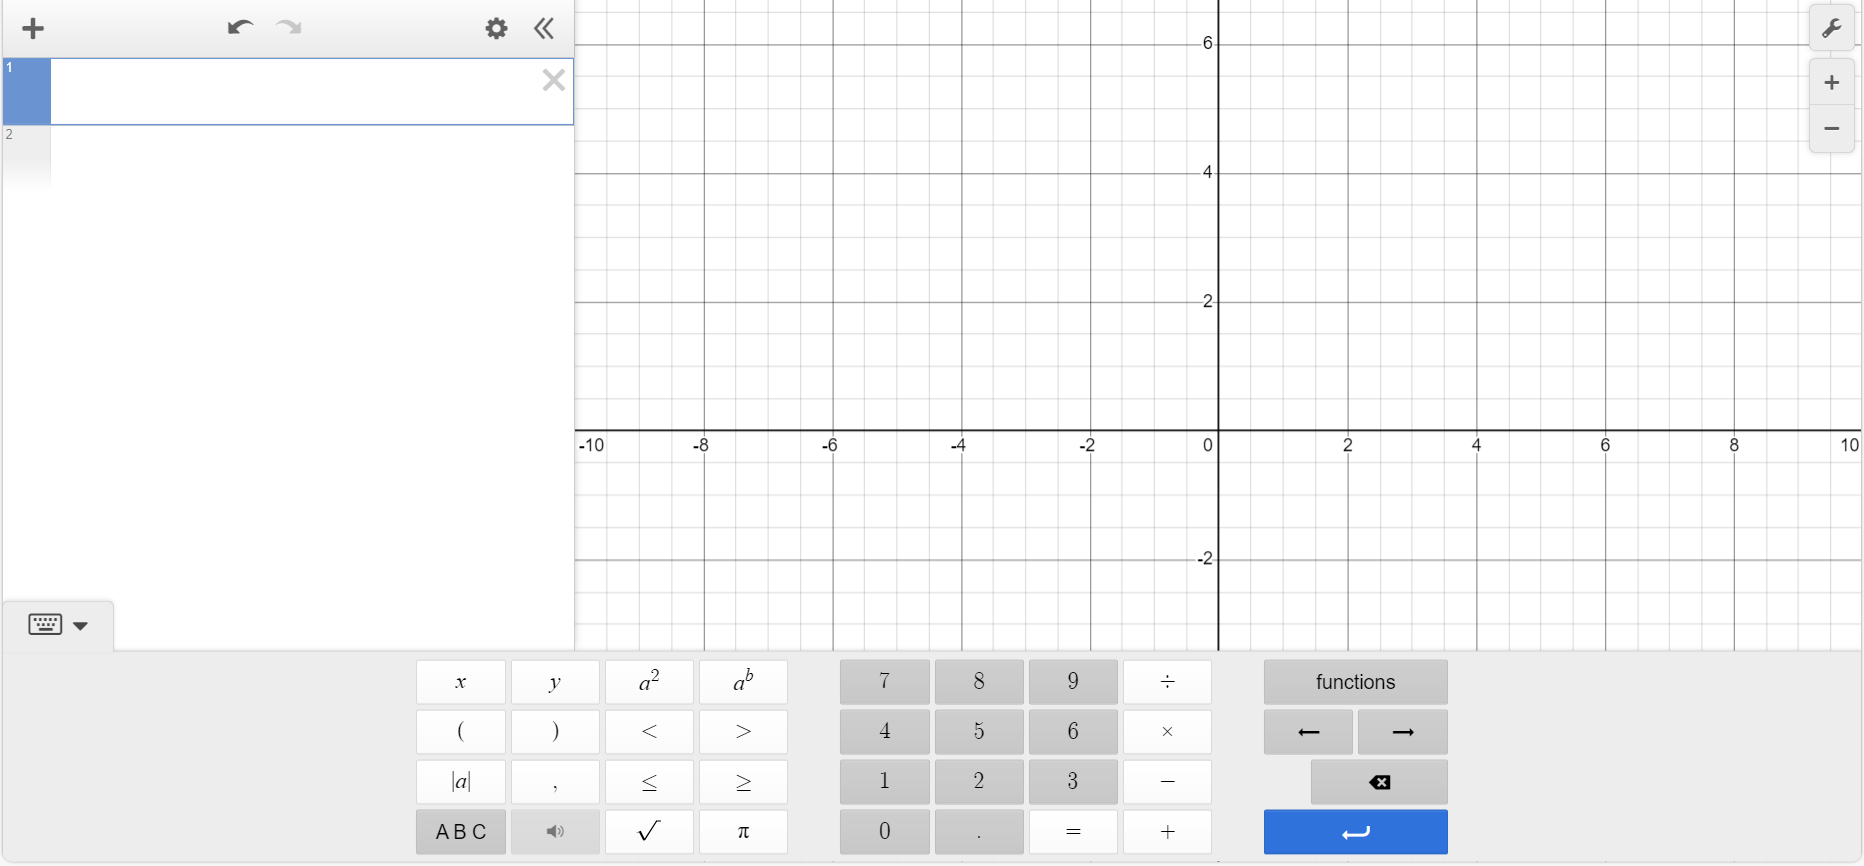
This will bring up a keypad with many different functions (see below):
To get rid of it, simply press the down arrow by the keyboard icon (see below).
![]()
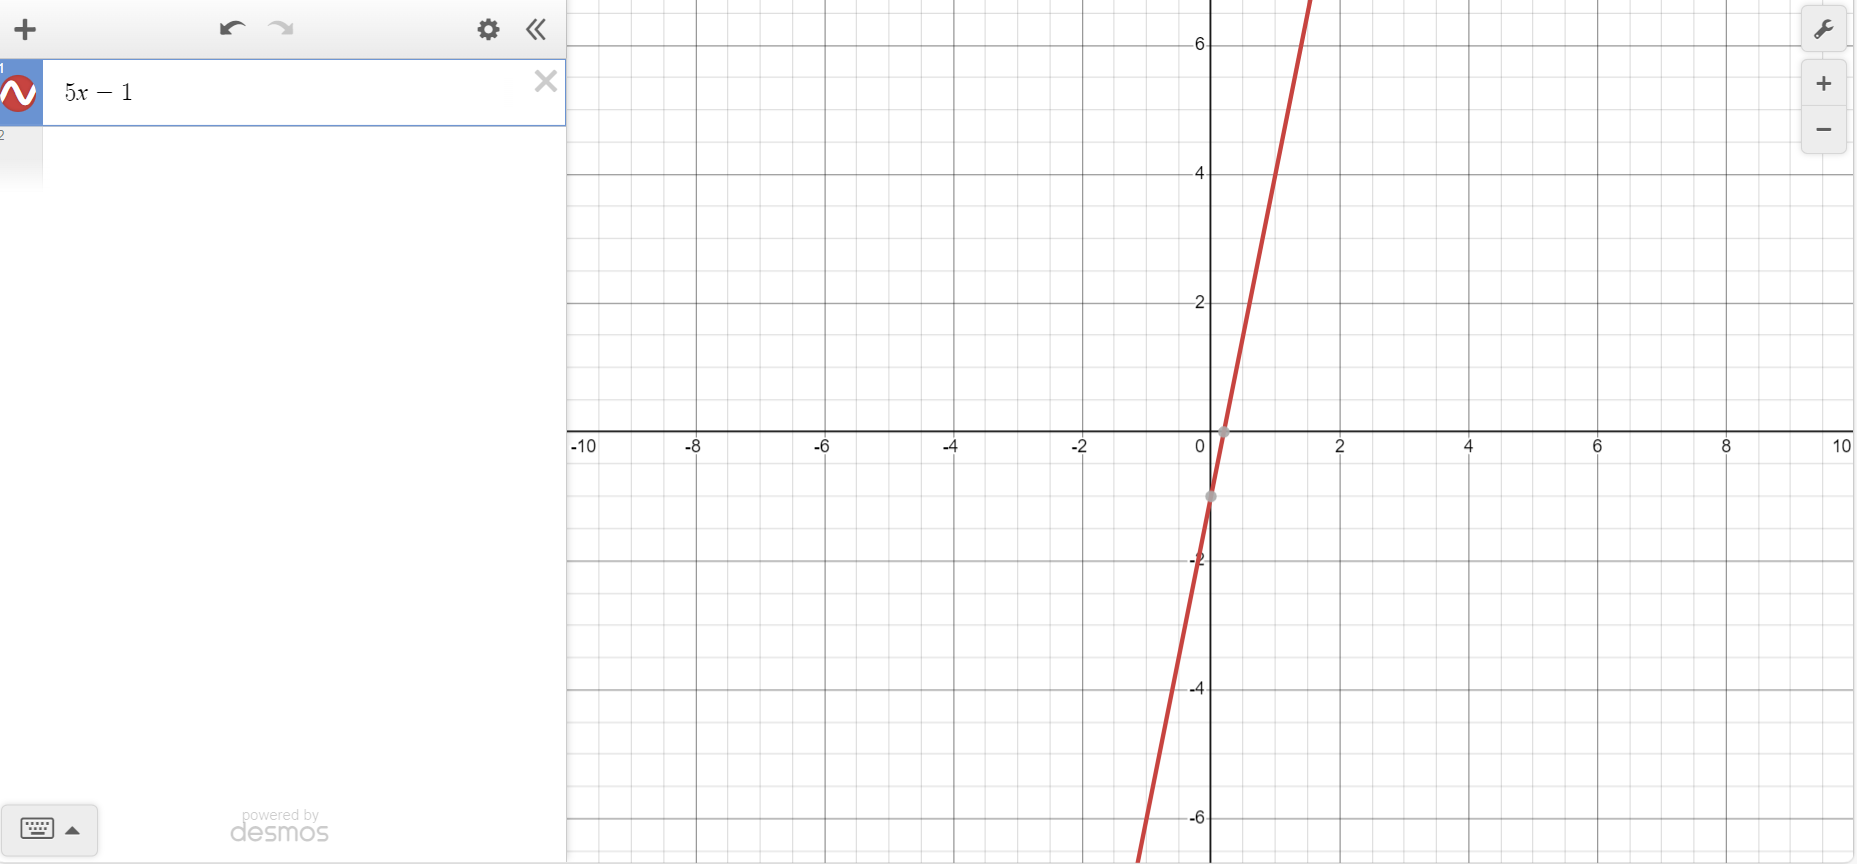
Let's say we wanted to graph a line using the Desmos Calculator. We could do that rather easily! If we wanted to graph the line y = 5x - 1, we could either enter:
or
in the cell. See below:
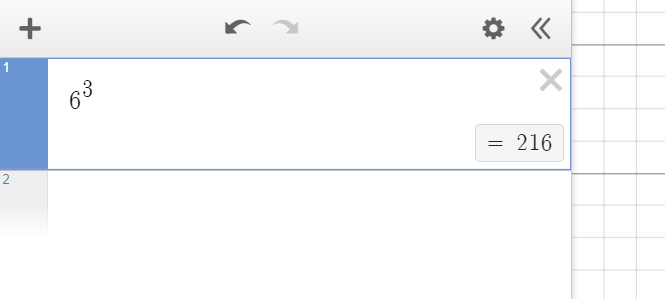
Let's say we wanted to know was 63 is. We can figure that out with Desmos pretty easily. We start by typing 6 in a cell, then shift and 6 to get an exponent. Then type 3. The result, which you get without hitting enter is 216, the value of 63! (see below)
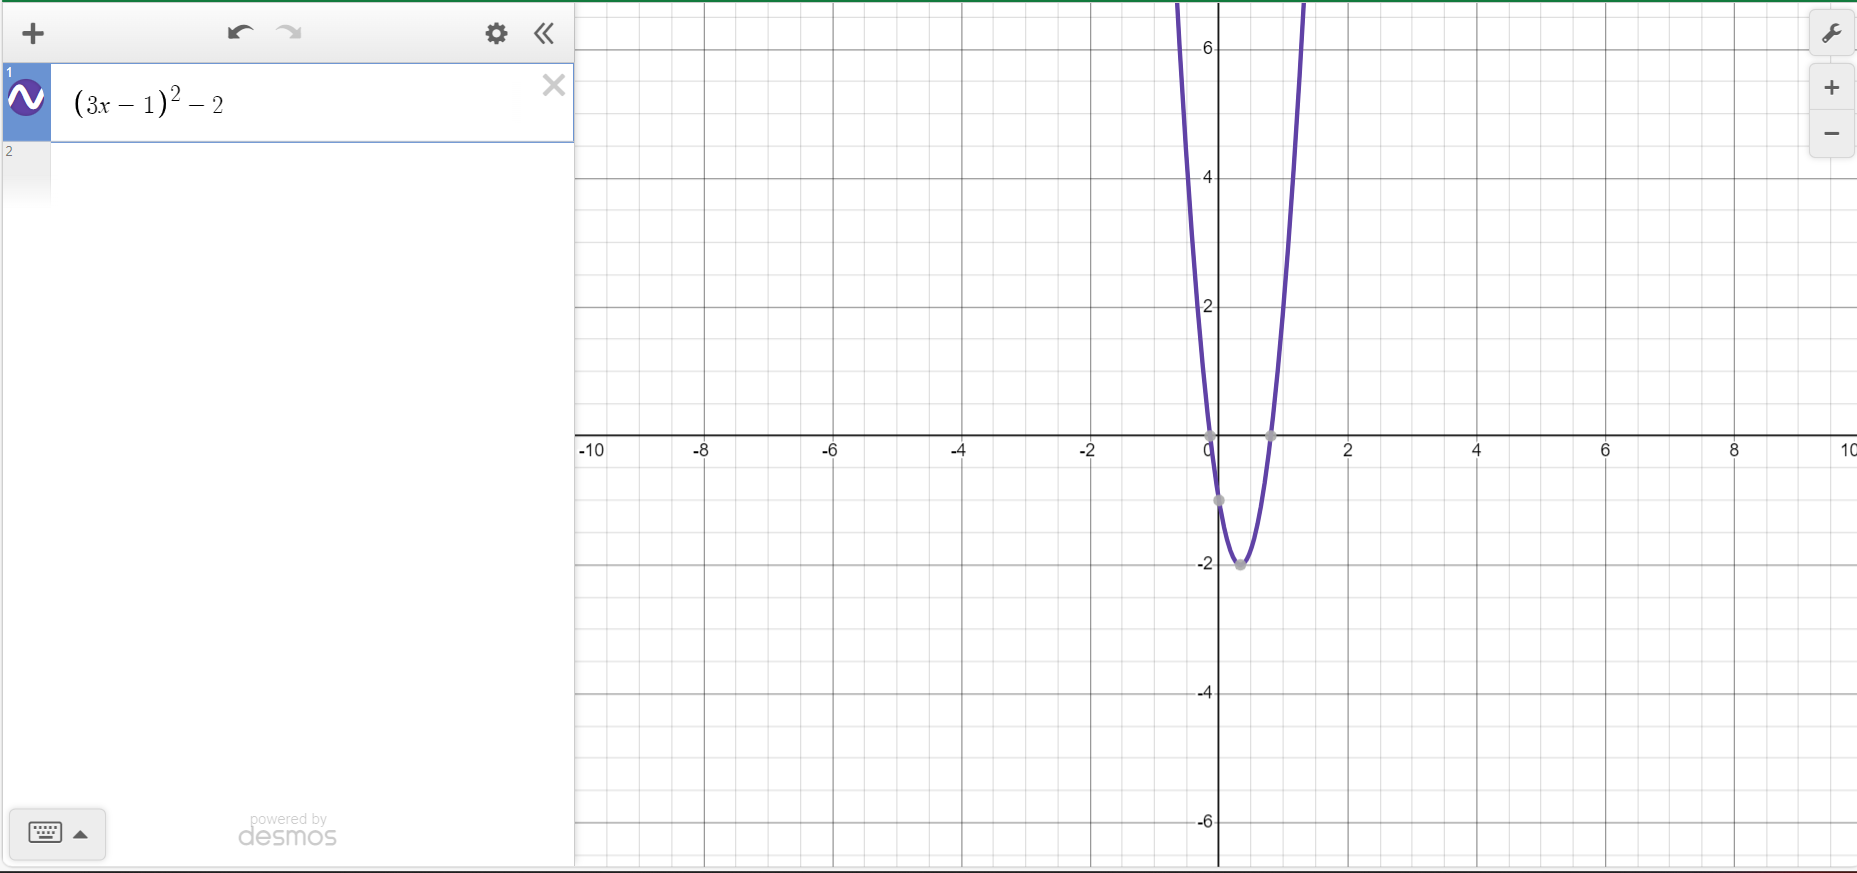
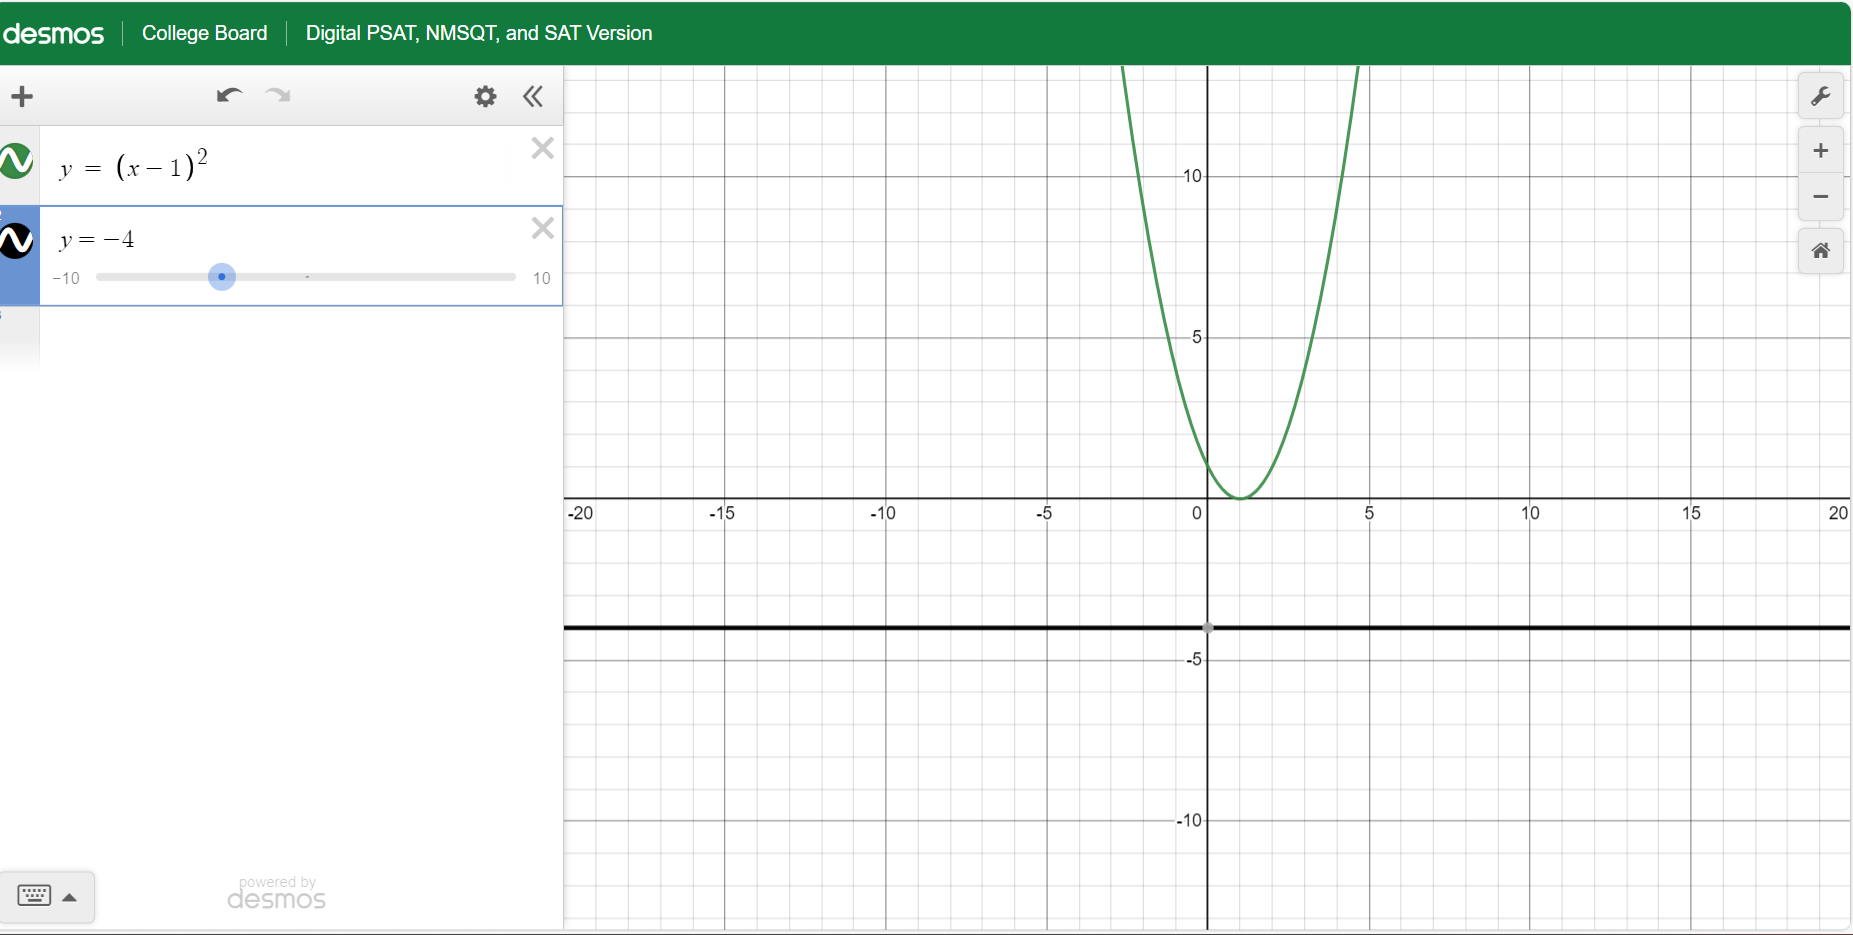
Let's say you wanted to graph the parabola y = (3x - 1)2 - 2. You don't need the y = part. All you have to do is:
To solve a system of equations you'll want to figure out the points of intersection of a system. For instance, what are the solution or solutions to the following system of equations:
You can figure this out using Desmos by putting the following into two different cells and looking for the points of intersection:
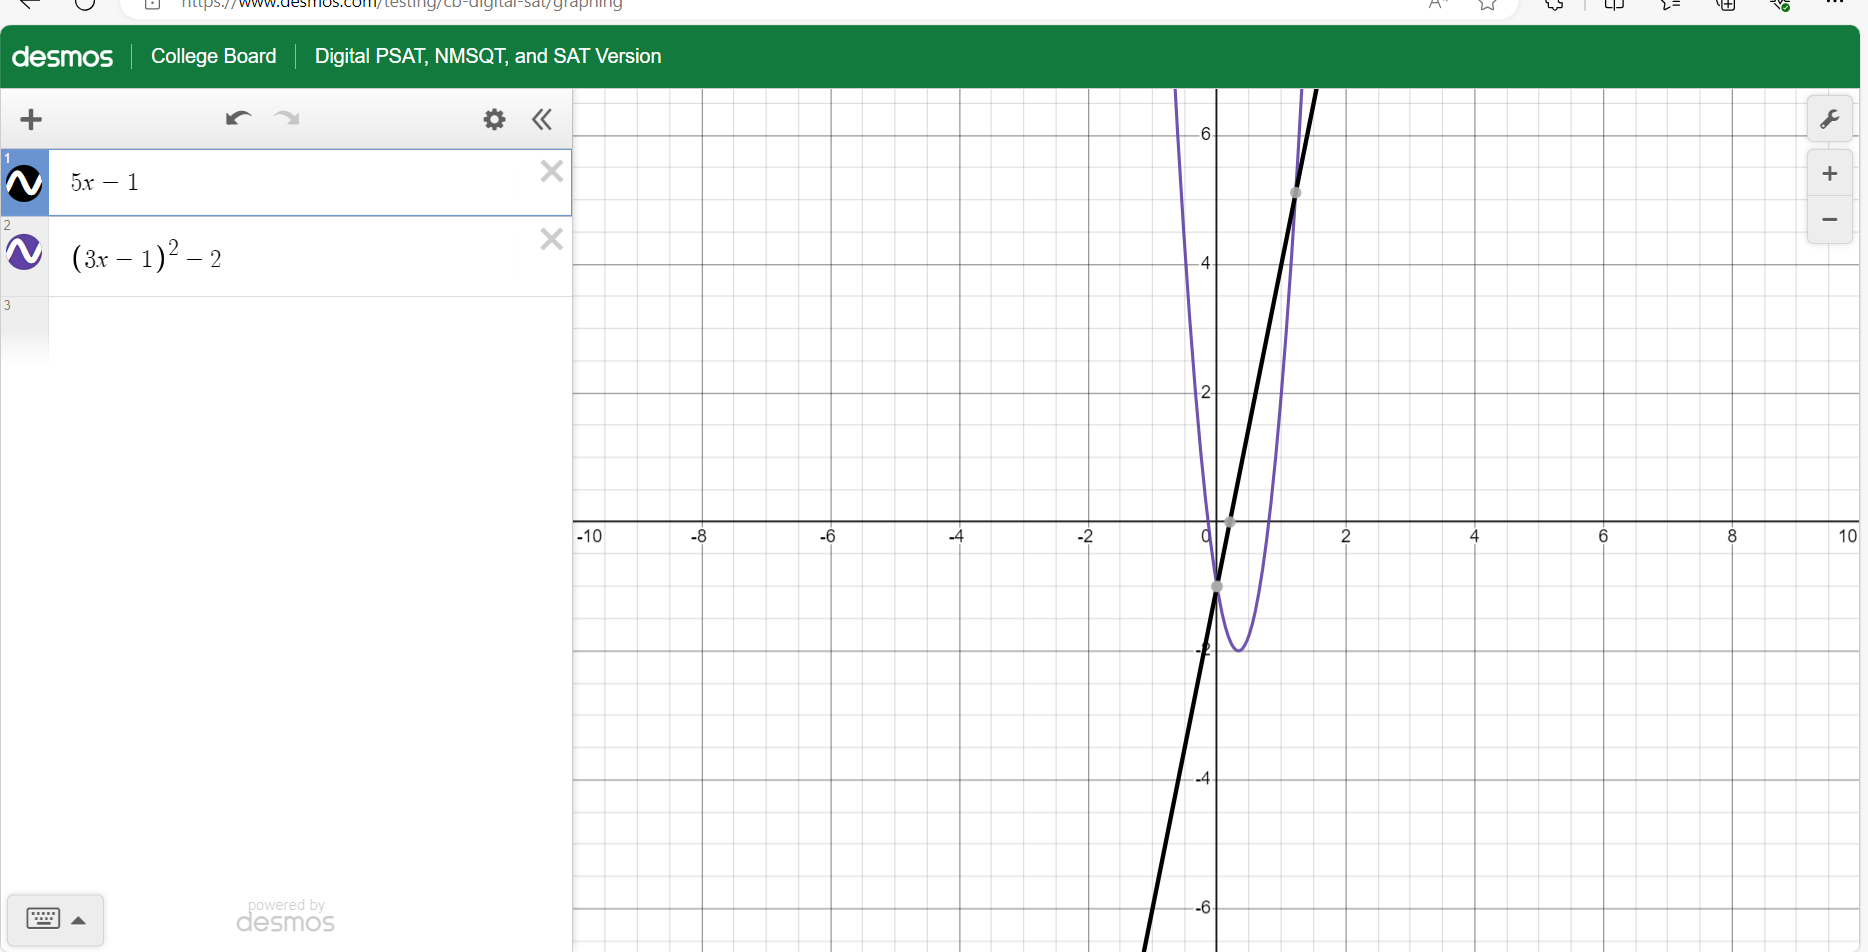
You can see from the graph that the two solutions to this system are:
(To find the value of these points hover your cursor over the point)
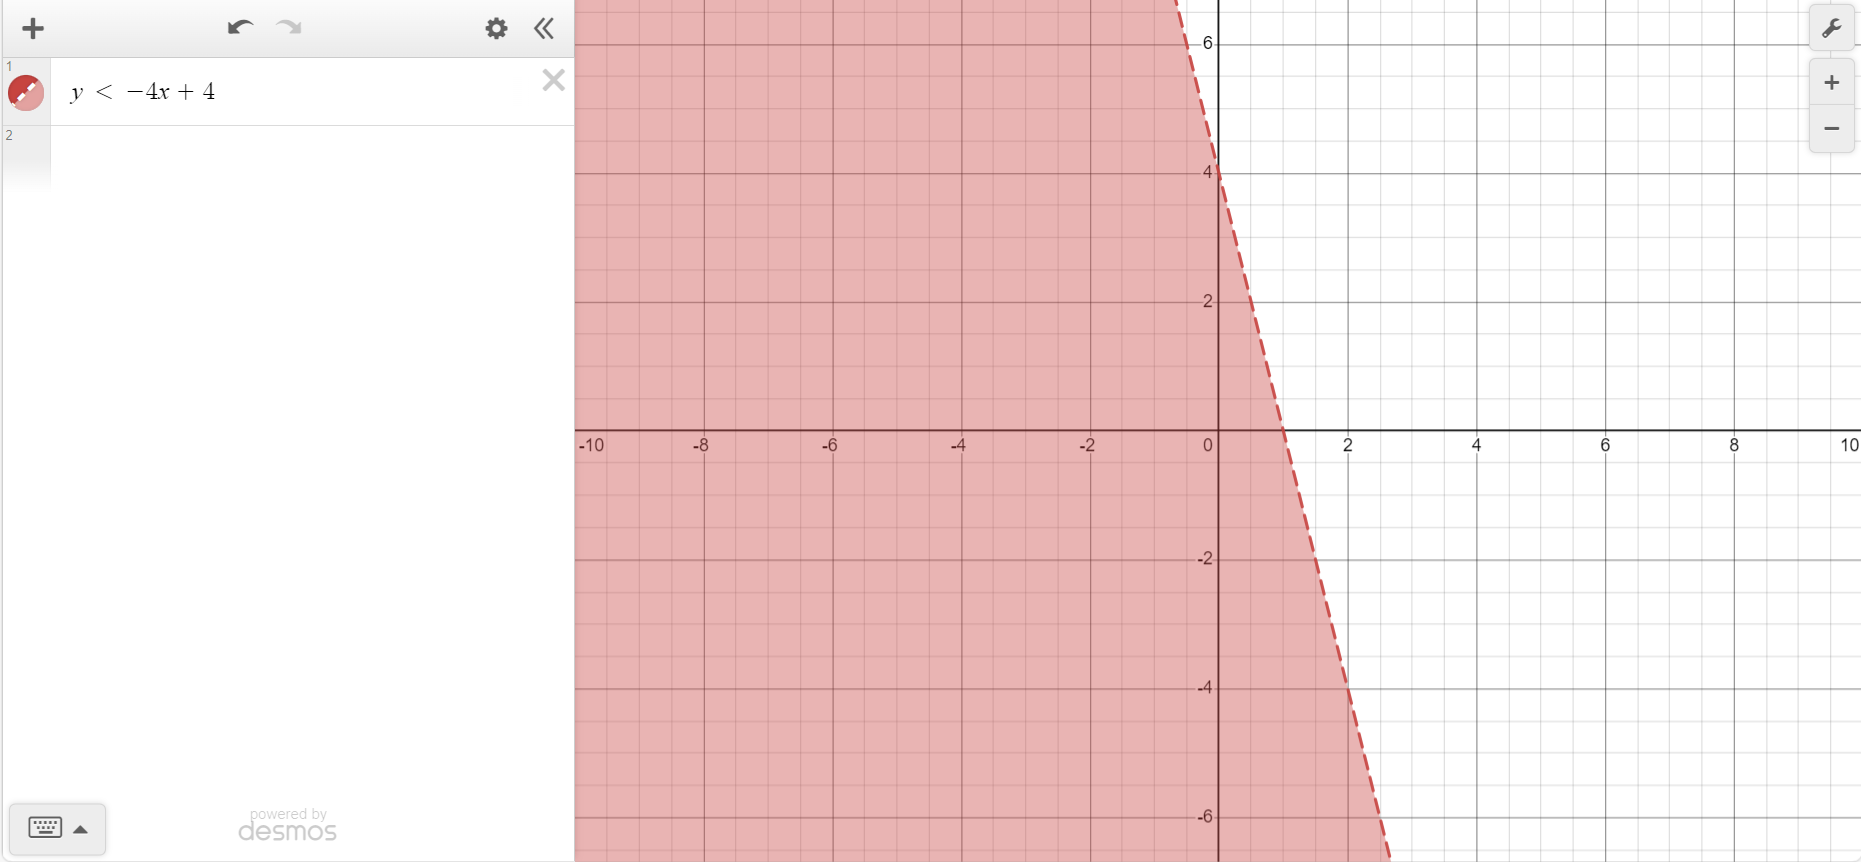
Here is a sample SAT question from A College Board Sample SAT Test (It is question 4 on the math portion):
Which point (x,y) is a solution to the given inequality in the xy-plane?
We can use desmos to solve this. First we'll put in the inequality:
We will then plot the points as follows. Click on the label to see each individual point.
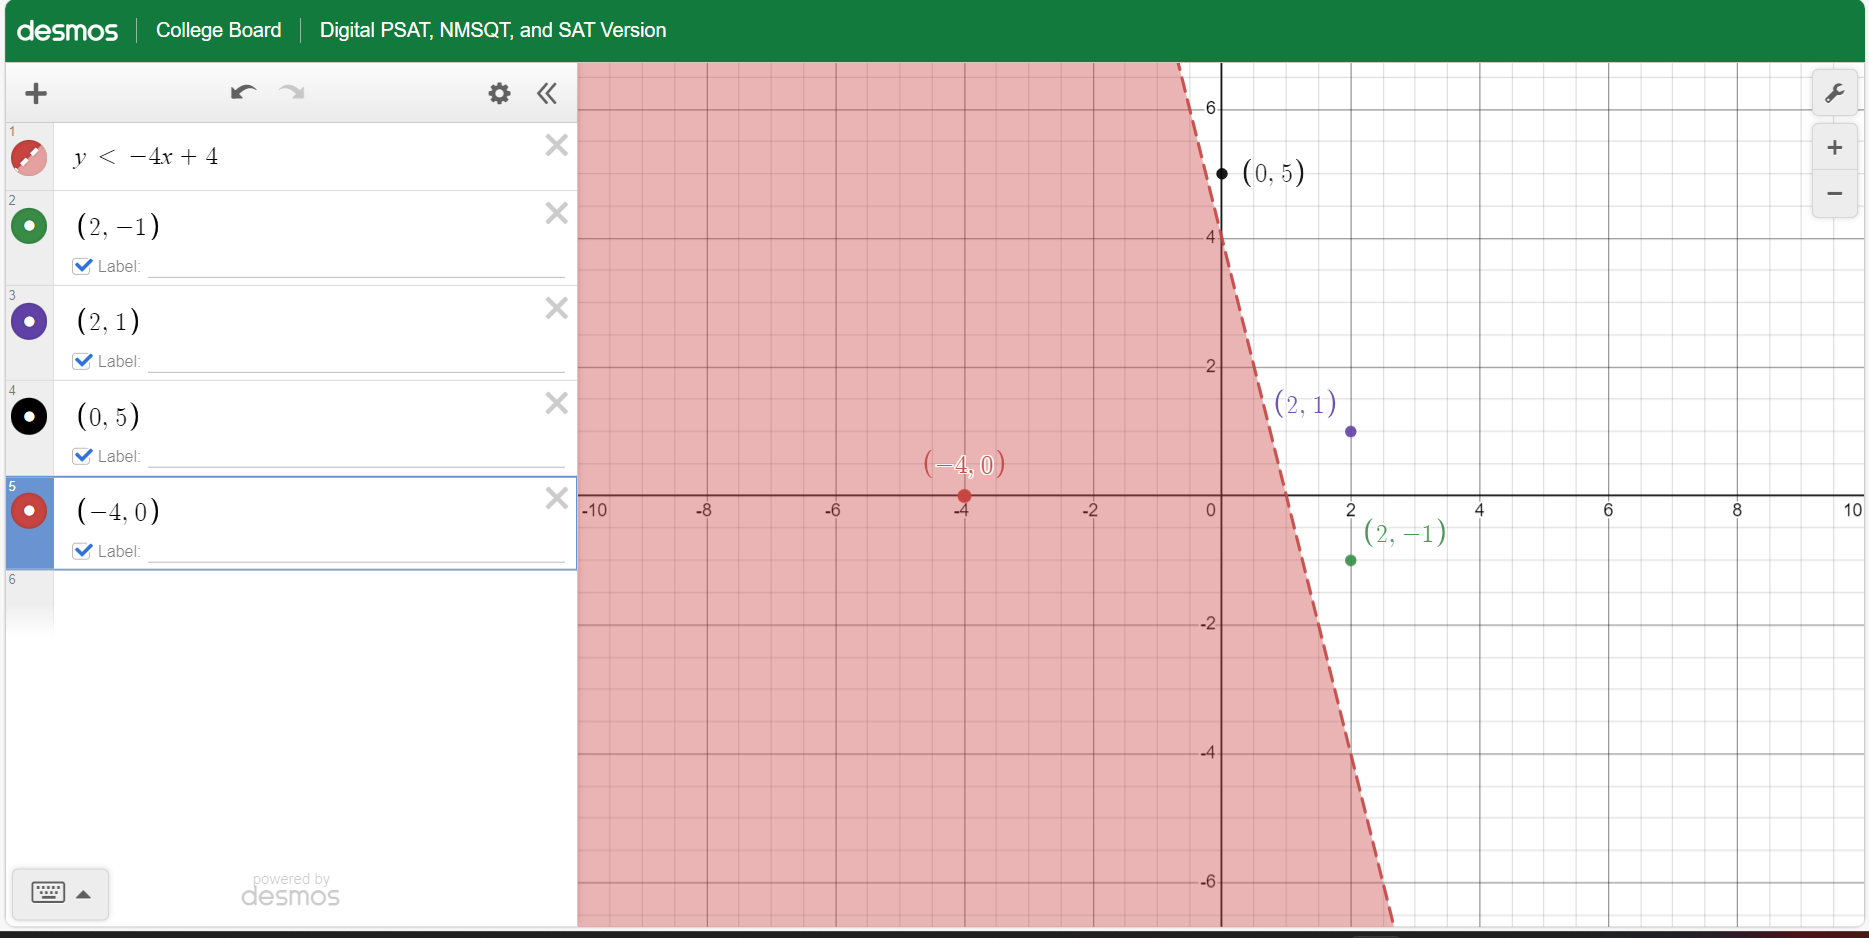
We can see that (-4, 0) is the only point that is in the shaded region, hence D) (-4, 0) is a solution to the inequality!
Here is another question from the College board sample test (question 9):
How many distinct real solutions does the given equation have?
We can think of solving this as solving a system of equations. We can write the two equations as:
And place each of these equations in a different cell and see where they intersect.
You'll notice the equations DO NOT INTERSECT, therefore there are zero (D) distinct real solutions!
You can answer advanced math questions with Desmos as well. Consider the following question from the College Board Sample SAT Math Test (question 10).
Which expression is equivalent to:
The choices we have are:
We can plug these into desmos (using the keyboard):
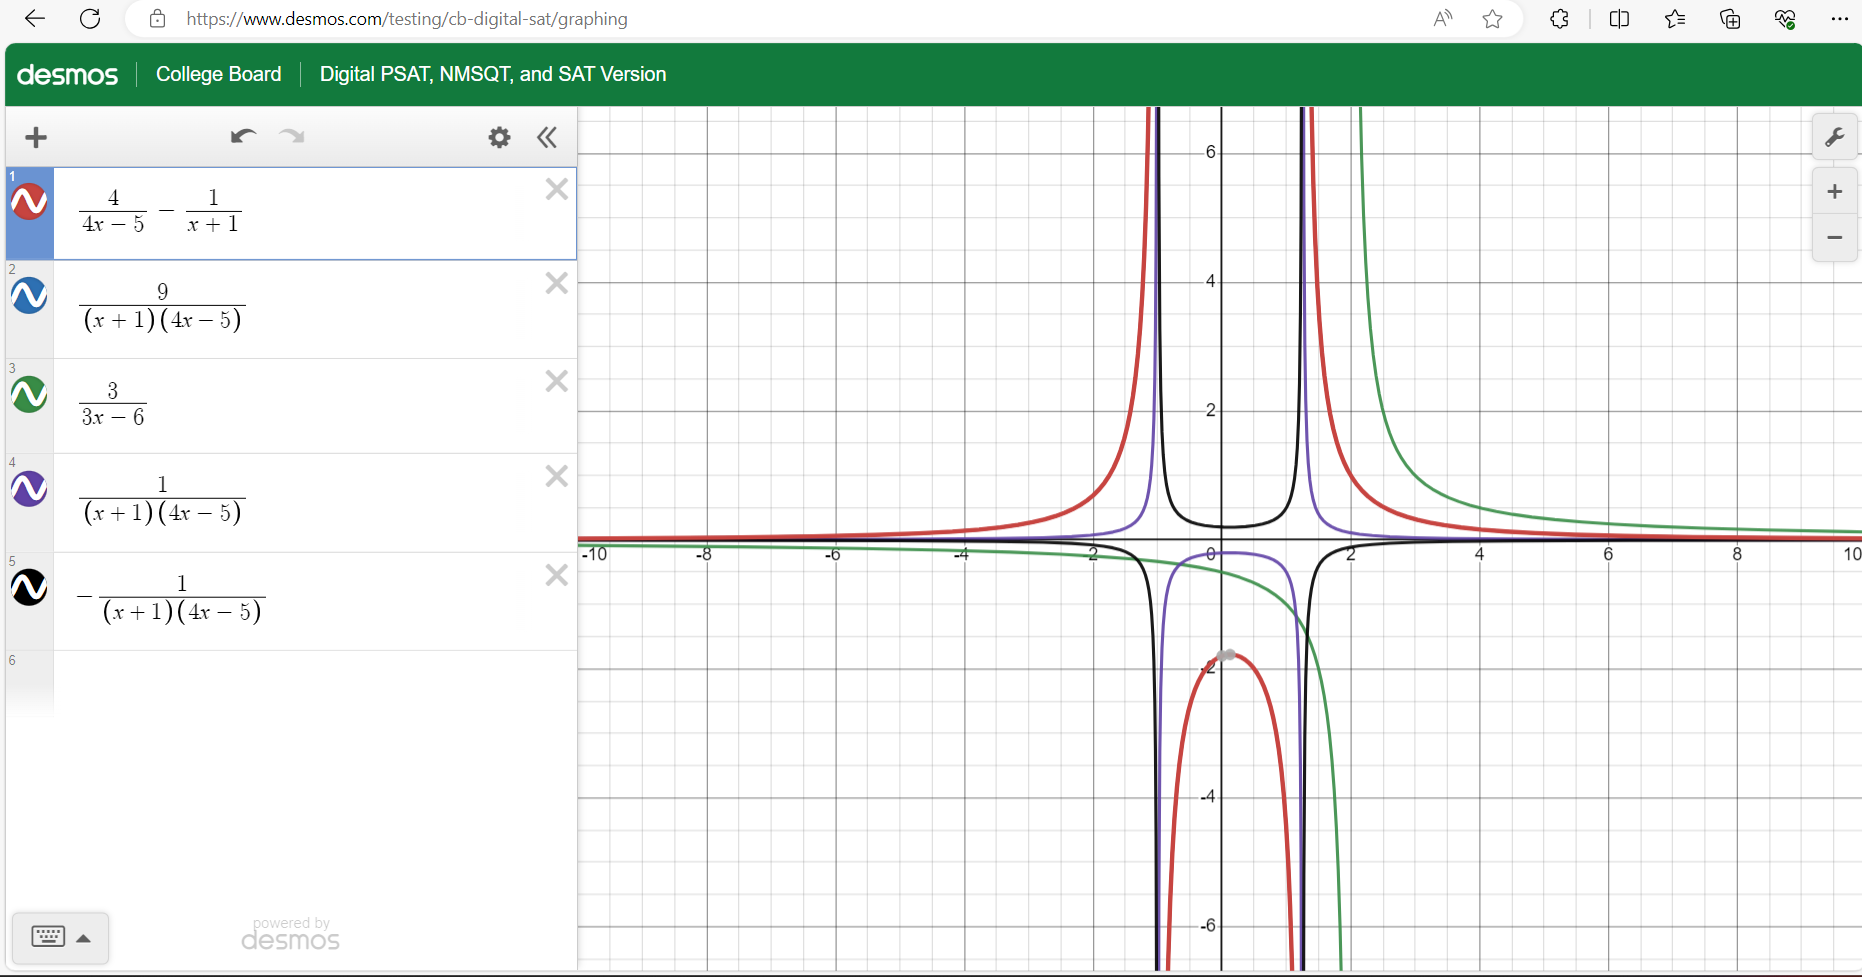
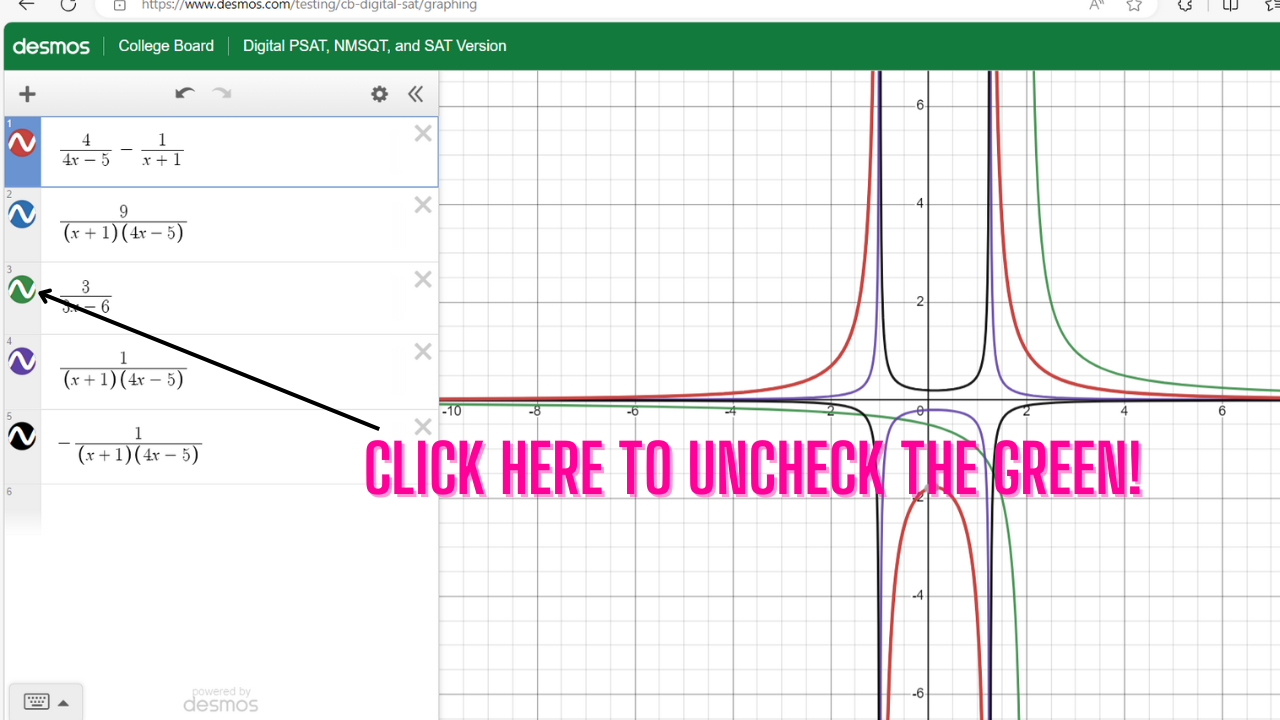
This looks confusing at first but if we uncheck the colors by each graph we can soon see that A is the only one that matches. (Try it yourself, see below, where to click)
Consider the following problem:
We can solve this by distributing the 4, combining like terms and isolating x ... or just type it in to Desmos and see where the line cross the x-axis. I'll choose the latter as it's much faster and time on the SAT matters! (see below).
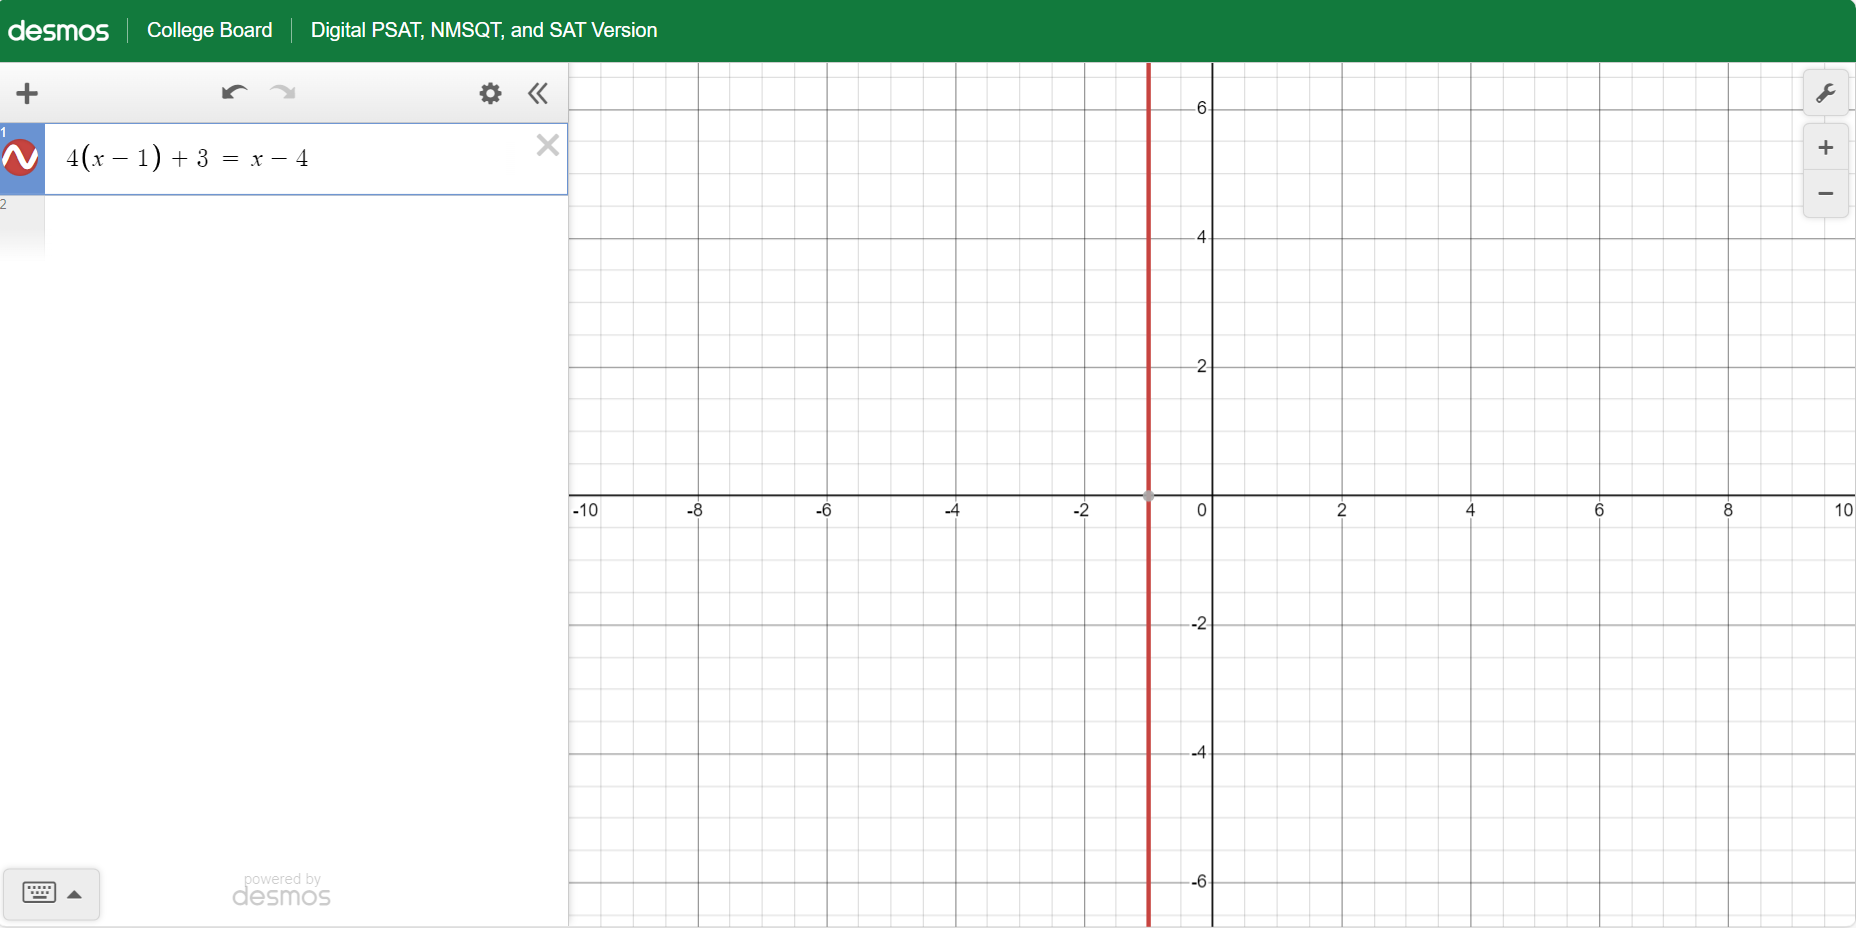
You can see the line crosses the x-axis at -1, so our solution is x = -1.